Friday, July 13, 2012

JENNIFER Structure

JENNIFER Structure

1) JENNIFER AGENT
Installed in each web application server, JENNIFER Agent collects the performance data and transmits them to JENNIFER Server.
2) JENNIFER SERVER
JENNIFER Server receives the performance data from JENNIFER Agent then processes and displays them in JENNIFER Control dashboard for managing statistical data and alerting the problem
and error, etc.
3) JENNIFER REPOSITORY
Data processed by JENNIFER Server is stored in DB File system (JENNIFER Repository) and JENNIFER retrieves data necessary for system performance analysis from there.
4) JENNIFER CLIENT CONSOLE
JENNIFER Client console uses java applet and web browser and does not require installation of client. Thus, user can access JENNIFER client from any internet enabled computer.

Supported Platform
OPERATING SYSTEMS
AIX 4.3.3, 5.x 32bit, 64bit
HP-UX 11.x 32bit, 64bit, Itanium 64bit
Sun Solaris2.8, 2.9, 10 32bit, 64bit,x86
Intel Linux 32bit, Redhat Itanium 64bit
Compaq Tru64 UNIX OSF1
Microsoft Windows
2000,XP,2003,Vista,2008,Window7
IBM iSeries(AS400) for WebSphere
IBM z/OS for WebSphere, zLinux
Java APPLICATION SERVERS
BEA WebLogic 5.1, 6.x, 8.x, 9.x, 10.x, 11.x
IBM WebSphere Application Server3.5, 4.x, 5.x, 6.x, 7.x
Tmaxsoft JEUS 3.x, 4.x, 5.x, 6.x
Oracle Application Server 9iAS, 10gAS, OC4J, ERP
SUN Application Server 7.x, 8.x, 9.x
Fujitsu Interstage 5.x, 6.x, 7.x, 8.x
Hitachi Cosminexus 7
Sybase EAServer 4.x, 5.x
Macromedia JRun 4.x
Apache Jakarta Tomcat 3.x, 4.x, 5.x, 6.x
Caucho Technology Resin 2.x, 3.x, 4.x
RedHat JBoss Application Server 3.x, 4.x
Apache Jserv
GlassFish 1.x, 2.x, 3.x

Do you know Jennifer? (4)

JENNIFER and X-VIEW

Response Time Scatter Graph (X-VIEW)
JENNIFER’s response time scatter graph, called X-View, presents the response time of all service transactions as plots in a scatter graph. The vertical axis is the response time of an individual transaction and the horizontal axis is the end time of each transaction’s runtime.


Using the X-View, user can not only detect the delay in response time for the specific transaction(s) but also the root-cause behind the delay in the response time. The plots may form different patterns in X-View (see above screenshots) that user can use to identify or predict the performance problem. The X-View is a powerful and intuitive tool that is more useful than using many line graphs combined.

JENNIFER X-View / High Level Transaction Profiling
Within the X-View, select one or more plots using the drag &drop feature with the mouse to see the specific details about the selected transactions such as Method Call Path, SQL, File/Socket and others. When the plot(s) is selected, a separate pop-up screen with the individual transaction information (X-View) appears.
The X-View displays the detailed information in following areas: 1) SQL queries, 2) External system and interface (including Legacy) , 3) accessed files and sockets, and 4) Tier and Layer high-level class/method profiling information.

  • Analysis of Response Time for ALL Transactions
  • High-level Class/Method Dynamic Profiling for All Transactions
  • JDBC and SQL Tracing (Including BIND Variable)
  • Legacy, External System Interface
  • File/Socket Connection Tracing
  • Dynamic Profiling for the Tier/Layer Class/Method 
  • Method Parameter, Return Data Tracing
JENNIFER Unique Feature

Dynamic Profiling
JENNIFER can register additional package, class, method and/or activate/deactivate transaction profiling without restarting the web application server.

Dynamic StackTrace
The traditional method for extracting Java Full StackTrace is intentionally causing an exception/error for an application resource and outputting it onto the stacktrace; JENNIFER can register a class/method during operation, allowing dynamic full stacktrace of additional class/method without changing the application source code.

Monitoring per Domain
In a large scale of enterprise environment, many different business systems may exist, triggering a need for a solution that individually monitors each business system under integrated one
view. JENNIFER provides performance management capability per domain that allows the user to allocate multiple business systems into different domain and manage each system under one
umbrella.

Extended Monitoring Adaptor
JENNIFER extracts the performance data from web application server and communication between Java Application Server and other system devices. JENNIFER features Extended Monitoring
Adaptors Functionality (EMAF) that allows performance data from other system devices to be extracted and inputted into JENNIFER for analysis and reporting. Broadly, JENNIFER offers 3 types of Extended Monitoring Adaptor Functionality.

REMON : JENNIFER supports user-customizable extended adapter written in shell script, java, c-library, Telnet, SSH, SQL,and others.


ExtraAgent : ExtraAgent is imbedded in Java Application Server interface and communicates directly with REMON(Extended Monitoring Adaptor).

LogWatcher : LogWatcher extracts the data from various formats of user log files and provides real-time analysis,monitoring, and alert services.

Application / SQL Tuning
The response time of executed queries can be traced without affecting the system performance. The relative connection between SQL and application that used it, and the proportion of response time spent on SQL over the total response time of the application can be viewed and analyzed via JENNIFER.

Automatic Alert System
JENNIFER has classified many different error types that can exist in application which negatively affects the system performance. Error/Exception is grouped into “Critical”, “Error”, and “Warning”
and managed by date/time. User can also add a new error/exception type using extension adaptor.
Dynamic Class / Method Level Profiling SQL Tracing (Including BIND Variable) Method Parameter/Return Key Value Tracing Backend Transaction Tracing (CTG, WebT, TC/Jolt)
TOP 10 Application and SQL File/Socket Connection Tracing

Statistical Analysis and Reporting

Statistical Analysis of Services
JENNIFER can show the quantified statistical data such as visitor count, response time, resource usage, and other performance/business data concerning the service transactions.
User Customizable Reports
JENNIFER can store the performance data into the DB and showthe data in customizable reports.
The report template for commonly used performance/businessreports are also available.
Report Scheduler
Report scheduler allows user to generate periodic (daily/weekly/monthly) reports automatically.

Do you know Jennifer? (3)

Jennifer Dynamic Monitoring
In Application Performance Management, the concept of enterprise performance monitoring is classified into two part: Service Monitoing and Resource Monitoirng

Service Monitoring
When monitoring the status of the application services, it is import to retrieve the performance data in real-time and grasp the mutual relationship between each service transactions. A delay in transaction response time may have originated from not just that transaction but from a combination of all transaction’s resource bottleneck. JENNIFER provides following features in service monitoring.
  • Concurrent User
  • Active Service
  • TPS, Arrival Service Rate
  • Real-Time Transaction Response Time
  • Application Naming Dynamic Substitution
  • SQL Tracing (Including BIND Variable)
  • Transaction Profiling(Class/Method Level)
  • HTTP POST Request KEY/VALUE Tracking

Resource Monitoring
Resource monitoring includes managing the physical and logical resources used in running an application service. JENNIFER provides following features in resource monitoring.
  • JDBC Connectio Pool Status
  • JVM CPU Usage (KERNEL/USER/IO)
  • JVM Heap Memory Usage
  • FILE Read/Write Status
  • TCP/IP Socket Input/Output Tracking
  • Collection/Live Object Count
  • Status of Java Application Server Resource Used by JMX

Performance Data Analysis
The performance problem in a web system can be categorized into two types: 1) conditional performance problems caused by anomalous circumstances or 2) relative performance problems
caused by an increase in load and throughput that is more than the amount system can handle. JENNIFER possesses various types of data collection and analysis modules for detecting all
types of performance problems.
  • Memory Leak Detection
  • Java Collection / Live Object, Application Tracing
  • JDBC Connection / Statement / ResultSet Tracing
  • JDBC Transaction (Commit/Rollback) Tracing
  • Application Exception Tracing
  • SQL, SQL Exception Tracing
  • Dump on Running Service
  • HTTP Session Dump Capability
  • Reporting Loading Class Hierarchy Analysis
  • Loaded Class Bytecode Deassembling
Real Time Active Service Monitoring
JENNIFER illustrates active service runtime in different color and displays it via the equalizer graph in real time.

JENNIFER transmits the performance data through reverse-direction protocol that connects from JENNIFER Server to JENNIFER Agent whenever user requests for the data. Using this method, JENNIFER can extract the snapshot information of the running active services. Active service data shown in JENNIFER is not a summarized data of events that occurred in the past but the
real-time data concerning active services.


Thursday, July 12, 2012

Do you know Jennifer? (2)

JENNIFER Competitive Advantage

Each detail in JENNIFER’s design was chosen with high consideration that they add intrinsic value to the user experience, whether it’s adding a new feature, choosing placement of a module, or selecting color of the graphics. Because of this attention-to-detail, JENNIFER is assessed to be the most practical APM solution available in the market.

  • REAL-TEIM & INSIGHTFUL Performance Monitoring
  • Response time scatter graph (X-View)
  • Integrated Enterprise Performance Management
  • An Attractive Easy-Access Dashboard
JENNIFER’s Unique Features
  • Dynamic Profiling Configuration
  • Dynamic StackTrace Capability
  • Active Profiling Capability
  • Monitoring and Management per Domain
  • Extended Monitoring Adapter
  • Real-time Combined Log Monitoring
JENNIFER’s Unique Features (Advanced)
  • Performance Problem Diagnosis
  • Root Cause Analysis
  • Response Time Scatter Graph (X-VIEW)
  • Individual Transaction Profilling
  • External Resource Monitoring (CTG, Jolt, WebT, WTC)
  • Application / SQL Tuning
  • Memory Leak Detection and Tracking
  • Application Error Detection and Analysis
  • Peak Service Load Control Capability (PLC)
  • User Customizable Dashboard (Drag & Drop Feature)
  • System / Java Application Server Resource Monitoring
  • User customizable reporting system with templates

Do you know Jennifer? (1)

JENNIFER Product Summary

JENNIFER® is the Application Performance Management (APM) solution developed by JenniferSoft Inc. JENNIFER provides comprehensive
application performance management and operational support services for enterprise web system, performing tasks such as real-time
resource and service monitoring, immediate performance problem diagnosis, and effective performance problem resolution. We currently
have more than 400 of enterprise JENNIFER users and expect the demand to grow significantly.

JENNIFER Key Features
  • Comprehensive Dashboard
  • Real-time Resource/Service Monitoring
  • Performance Problem Diagnosis and Resolution
  • Application Tracing and Tuning
  • Statistical Analysis and Reporting on the Performance Data
Benefits


REALTIME & INSIGHT

JENNIFER enables users to intuitively analyze the performance of individual service transactions and all performance problems in real-time, and displays the data in its visually powerful dashboard to provide Insight into the system’s health. Each performance data displayed in JENNIFER dashboard is
well-organized in relation to each another to maximize user’s ability to absorb the information and
gain intuitive understanding and insight on the system status.


Why APM? Do we need it?

Application Performance Management (APM) is a component that is required to make the IT services in your organization transparent in terms of cost and usability. Today is APM solution must not only provide basic system resource monitoring data and business data as with traditional system Management solutions, but it must also be able to use these data effectively in performance troubleshooting as well as business strategy and capacity planning, effectively lowering the TCO (Total Cost of Operation) of the enterprise web system.

Are your WebSphere customers suffering from website performance issue such as system down or delayed transaction response time? Spending more than desirable time and resources troubleshooting web system performance issues? Traditional System Management Solution doesn’t provide adequate information for troubleshooting web system performance issues? Looking for additional ways to generate revenue through new and existing customer base?

Sounds like you need an Application Performance Management (APM) solution for web application servers.

My name is Edwin Seo with JenniferSoft Inc, a company that provides WAS APM solution and services for enterprise businesses. I am contact you to share with you about our APM solution for application server, Jennifer® and about business partnership opportunity between Mainline Information System Inc. and JenniferSoft.

What is APM and why is it necessary?

Application Performance Management or APM is the discipline within system management that focuses on monitoring and managing the performance and availability of resources for software application. APM solution is software that provides Application Performance Management services. In the past decades, the Web Application Server (WAS) market has seen significant growth as use of internet in every aspect of our lives has increased exponentially. Until 3~4 years ago, website performance problem has not been so significant overall that a separate APM solution was needed besides the Traditional System Management Solution. Often the website performance issues were resolved by simply adding more hardware or system administrators checking the codes manually, sometimes with self-developed solutions based on tools. But as web traffic became more congested and web systems got more complicated, APM solutions became necessary since the web site performance was causing a big impact on revenue or service level for many companies. Indeed, a study by Infonetics Inc. have found that average medium size companies lose 1% (approx. $1,000,000) of their annual revenue due to downtime or performance problem. Web Systems today has reached a point where simply adding more hardware is not practical (and expensive) and administrators cannot devote all of their time and resources monitoring system for problem and checking massive amount of codes to find and resolve system bottlenecks. Concept of APM solution was born to find a practical and cost effective solution to WAS performance problems.

JenniferSoft and Jennifer

JenniferSoft is a successful software development company from Korea that took over the Korean APM market by storm over international competitions such as CA’s Wily and Symantec’s i3 and we currently hold # 1 APM market share in Korea. We are looking for enterprise software distributor, re-seller, or SI company that provides web application server and related middleware software sales and services, who are interested in establishing a mutually beneficial partnership with JenniferSoft to generate additional revenue and provide invaluable services to WAS customers who are experiencing web system performance problems.

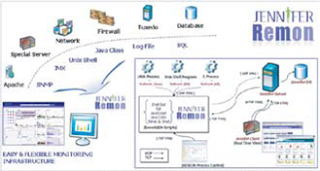
Developed by industry's leading WAS experts, Jennifer is designed to work with many different WAS such as WebSphere, WebLogic, JBoss, Tomcat, any many other web application servers, providing valuable services such as performance monitoring, performance troubleshooting, load controlling, etc., for the web system to ensure 24x7 system stability and maximized system performance. Jennifer features eye-catching comprehensive Dashboard that shows relevant monitoring data and various tools such as "X-View" and "Problem Determination" that assist in finding the root cause and resolving the issue quickly and effectively in real-time. X-view, dashboard interface, and other features in Jennifer are unique and other competing solutions have not yet developed anything like it. X-View is one of the main features we promote heavily because it is great for monitoring and problem solving in practice and we have used it to resolve performance problems for many of our clients. We believe that these features are parts of our arsenal of advantages that will draw positive feedback from the customer.

What mutual benefits can be gained from a business partnership with JenniferSoft?

1) Customer Satisfaction – After spending a ton of money on hardware and software, if the customer’s web system experiences performance problem, how would the it effect the customers? Implementing a quality APM solution ensures that the web system is optimized to output maximum performance, ensuring customer satisfaction. A satisfied customer is likely to comeback for continual business, especially if their web system continues to expand to meet the increasing traffic needs.
2) Sell more hardware and Enterprise Solution – While Jennifer can optimized a web system performance, it cannot replace hardware. That mean a web system can be only optimized as far as the existing hardware will allow. Jennifer has comprehensive capacity planning capability that allows the administrators to see whether there is a need for additional hardware resource. Using Jennifer, our resellers have easily made case for their customers about the needs of additional resource to resolve the performance problem. Since Jennifer can provide clear evidence of needs for more hardware resources, selling additional hardware to customer who needs it gets that much easier. Also, satisfied customers tend to return for more business when their web system expands. Also, we recommend that Jennifer's server portion resides on its on its own machine. Yes, its only needs one and yes, it not a lot but it is still extra revenue.
3) Increase revenue through referral fee or revenue sharing – Jennifer Offers generous incentive for distributors, resellers, and SI companies who refer or sell Jennifer to their new and existing customer. Also, Jennifer is easy to install, support, and use and should only require minimal resources to implement the solution and provide support to ensure high customer satisfaction. Most of all, Jennifer is an awesome solution and customers will recognize the benefit of using Jennifer Immediately. Once customer recognizes Jennifer’s features and benefits, it should be easy to recommend and sell Jennifer to customers. For past success stories, please visit our website.

The APM market seems to be full of well known players such as Symantec i3, CA’s Wily, and Mercury. How do you folks position JenniferSoft against these players?

Currently, APM market has 3 giants that are well known (CA's Wily, Symantec i3, Mercury) and many other smaller companies. However, the APM market is still very new and even the well known APM products by the software giants such as CA and Symantec have not yet fully matured. The standards for the APM solutions has not been yet set; many design flaws and weaknesses exist in current APM solutions, and because of this, there are still debates happening amongst the tech communities today about the potential benefit or value received from implementing an APM solution. Many of today's APM solutions may look fancy and promise to do all kinds of stuff, but in practical use, it is often difficult to implement, cumbersome to use, and don’t offer much help in actually finding the bottleneck and resolution. In that respect, I think that we have a good opportunity to start setting the standard for the market. I believe that our product is on the right path in defining a standard for APM solution as a whole, and we are planning to do our best to promote our software so that people can try it out for themselves and decide on it.


If you are interested in learning more about APM, Jennifer and how partnership with JenniferSoft can benefit your company, please contact me. My contact information can be found below.


Thanks

Edwin.S.