Response Time Scatter Graph (X-VIEW)
JENNIFER’s response time scatter graph, called X-View, presents the response time of all service transactions as plots in a scatter graph. The vertical axis is the response time of an individual transaction and the horizontal axis is the end time of each transaction’s runtime.

Using the X-View, user can not only detect the delay in response time for the specific transaction(s) but also the root-cause behind the delay in the response time. The plots may form different patterns in X-View (see above screenshots) that user can use to identify or predict the performance problem. The X-View is a powerful and intuitive tool that is more useful than using many line graphs combined.
JENNIFER X-View / High Level Transaction Profiling
Within the X-View, select one or more plots using the drag &drop feature with the mouse to see the specific details about the selected transactions such as Method Call Path, SQL, File/Socket and others. When the plot(s) is selected, a separate pop-up screen with the individual transaction information (X-View) appears.
The X-View displays the detailed information in following areas: 1) SQL queries, 2) External system and interface (including Legacy) , 3) accessed files and sockets, and 4) Tier and Layer high-level class/method profiling information.

- Analysis of Response Time for ALL Transactions
- High-level Class/Method Dynamic Profiling for All Transactions
- JDBC and SQL Tracing (Including BIND Variable)
- Legacy, External System Interface
- File/Socket Connection Tracing
- Dynamic Profiling for the Tier/Layer Class/Method
- Method Parameter, Return Data Tracing
Dynamic Profiling
JENNIFER can register additional package, class, method and/or activate/deactivate transaction profiling without restarting the web application server.
Dynamic StackTrace
The traditional method for extracting Java Full StackTrace is intentionally causing an exception/error for an application resource and outputting it onto the stacktrace; JENNIFER can register a class/method during operation, allowing dynamic full stacktrace of additional class/method without changing the application source code.
Monitoring per Domain
In a large scale of enterprise environment, many different business systems may exist, triggering a need for a solution that individually monitors each business system under integrated one
view. JENNIFER provides performance management capability per domain that allows the user to allocate multiple business systems into different domain and manage each system under one
umbrella.
Extended Monitoring Adaptor
JENNIFER extracts the performance data from web application server and communication between Java Application Server and other system devices. JENNIFER features Extended Monitoring
Adaptors Functionality (EMAF) that allows performance data from other system devices to be extracted and inputted into JENNIFER for analysis and reporting. Broadly, JENNIFER offers 3 types of Extended Monitoring Adaptor Functionality.
REMON : JENNIFER supports user-customizable extended adapter written in shell script, java, c-library, Telnet, SSH, SQL,and others.
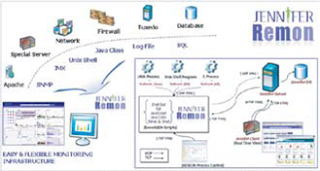
ExtraAgent : ExtraAgent is imbedded in Java Application Server interface and communicates directly with REMON(Extended Monitoring Adaptor).
LogWatcher : LogWatcher extracts the data from various formats of user log files and provides real-time analysis,monitoring, and alert services.
Application / SQL Tuning
The response time of executed queries can be traced without affecting the system performance. The relative connection between SQL and application that used it, and the proportion of response time spent on SQL over the total response time of the application can be viewed and analyzed via JENNIFER.
The response time of executed queries can be traced without affecting the system performance. The relative connection between SQL and application that used it, and the proportion of response time spent on SQL over the total response time of the application can be viewed and analyzed via JENNIFER.
Automatic Alert System
JENNIFER has classified many different error types that can exist in application which negatively affects the system performance. Error/Exception is grouped into “Critical”, “Error”, and “Warning”
and managed by date/time. User can also add a new error/exception type using extension adaptor.
Dynamic Class / Method Level Profiling SQL Tracing (Including BIND Variable) Method Parameter/Return Key Value Tracing Backend Transaction Tracing (CTG, WebT, TC/Jolt)
TOP 10 Application and SQL File/Socket Connection Tracing
Statistical Analysis and Reporting
Statistical Analysis of Services
JENNIFER can show the quantified statistical data such as visitor count, response time, resource usage, and other performance/business data concerning the service transactions.
User Customizable Reports
JENNIFER can store the performance data into the DB and showthe data in customizable reports.
The report template for commonly used performance/businessreports are also available.
Report Scheduler
Report scheduler allows user to generate periodic (daily/weekly/monthly) reports automatically.

No comments:
Post a Comment